Here's the BBC Talking Point on the subject.
UK Prime Minister Tony Blair is pushing for a global stabilization level but David King has warned this could be set so high it would cause a rise in global
temperature way above the EU limit of 2C.
What utter crap. Is he about to do a King Canute, and tell the tides to recede as well? And who are the EU to tell the planet what it can and cannot do with regards to climate change. Indeed, over a period of a hundred years or so, it should be called "weather". Climate is over thousands of years, and are major trends and changes.
Climate change has many factors feeding into it - and here's one of my favorites:
Water vapor is a greenhouse gas - remember... DHMO can kill! It is the most abundant greenhouse gas up there.
Seriously though, methane, which is a much more potent greenhouse gas than carbon dioxide is produced by cows farting in the field, as well as by wetlands, oceans and green vegetation (when alive). You don't hear the environmental lobby telling us to cut down rainforests which are pumping out CH4 now do you?
Here's a fanatical graph of greenhouse gas emissions. Please note that's fanatical - note the scale. 30 years is nothing. Why have they even bothered to produce this? Oh yes, because "Booga Booga Booga!"

(Graph source - NOAA data)
So as you can see, this is clearly bad. The world is going to end. It's all rising - it will gas us all, the ozone layer will run away, the earth will be scorched and in short, we're all fucked.
Or are we?
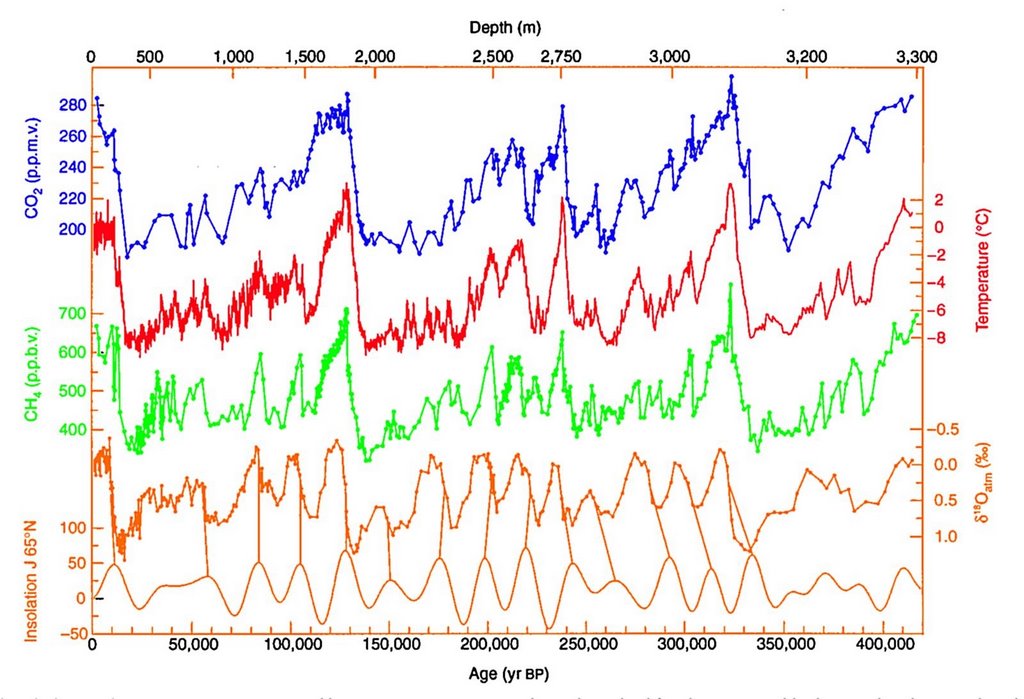
Here is a proper graph, using Oxygen isotopes as a proxy for atmospheric CO2 over a decent timescale. As in one that is more significant than a gnat's fart.
(Graph source - Leland McInnes)
This gives you a clearer picture that atmospheric CO2 fluctuates a lot, and is normal, and is dealt with by other natural processes. You'll notice it seems to be periodic too... I wonder what could cause that? Looks like approx 100,000 years for the major cycles and 20,000 for some of the minor ones. Oh - what else has periodicities like that? The Milankovitch cycles which describe the earth orbiting the Sun - next graph -
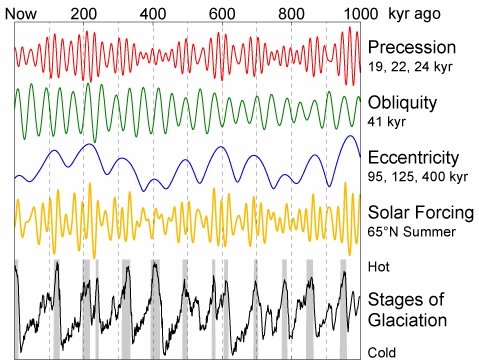
(Graph source - Dragons flight)
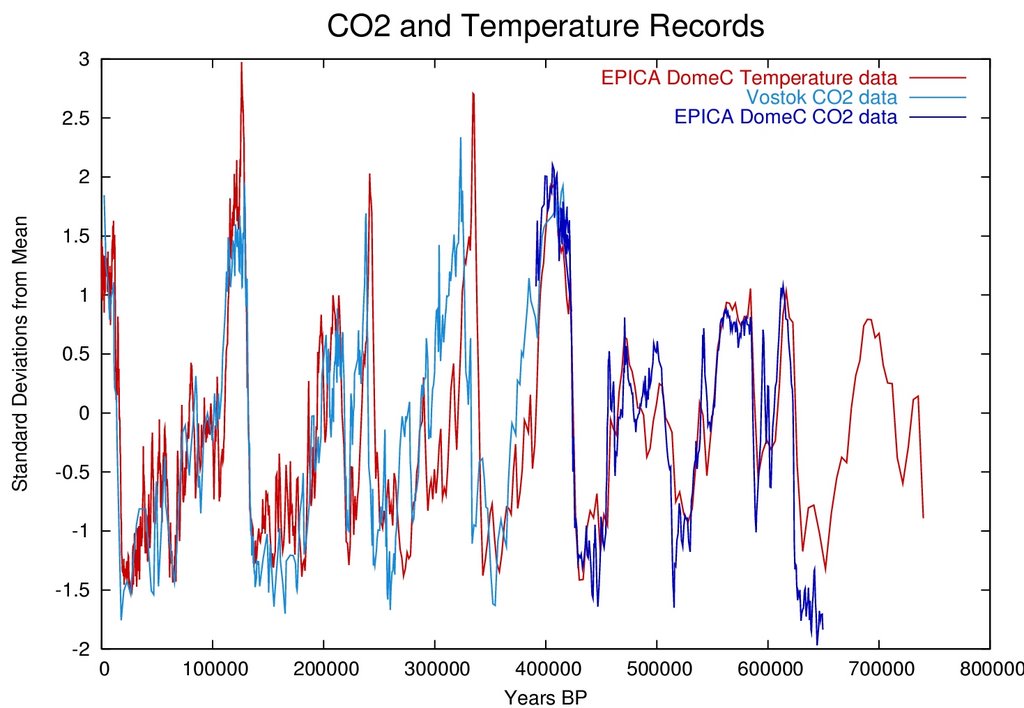
Why am I telling you about orbital wobble? Because it appears to have a direct effect on the heating (and cooling) of the planet. That simple. It has done for a lot longer than we humans have been on this earth. Trying to bring this back to the greenhouse gas graphs - here is one last one which is much more exciting showing CO2, CH4 and Oxygen with a temperature graph too. This one is a bit loud. It's from the Vostok ice cores...
(Graph source - The US Govt)
This one is pretty cool, since it shows you how the gases build up and decline, and how it affects temperature... Now, there are various questions as to what all the processes actually do... The basic black box style approach is relatively well understood - CO2 is sunk into oceans, and carbonates and so on, but some of the interactions are not fully understood. Remember the biologists only recently realized that green vegetation gives out methane.
We have a lot to learn about our climate, and the sort of nonsense that is spouted by the mass media is hardly good science or helpful. Yes, humans have an effect on the environment - but is there a problem with the climate model we're using (probably) and is there a problem with our understanding of the environment (definitely in some areas). The earth can and will cope with a lot of things we do to it - in ways we have and have not yet observed or theorised. However, this does not mean we should do nothing - we should strive to be good caretakers of this planet... But let's cut the crap, eh?

7 comments:
I saw a much clearer version of the CO2 and temperature graphs for the last few hundred thousand years recently (from a respected scientist too, not Wikipedia). He had to make the scale larger to fit the current levels in.
There's a lot we don't know about the climate, but we do know that the current behaviour doesn't fit the usual cycles from the period shown in your graphs. We're already out of the envelope and moving further away...
The graphs are reasonable - I have very similar ones in climatology texts on my shelf - they're just not as handy to link to on the interweb. The graphs are good. Stop whining.
We'd also be out of the envelope if there were a few major volcanic eruptions... We should also expect this cycle to be different, since we're here, and we're doing a lot more than just being the hunter-gatherers from previous cycles.
The graphs are reasonable to show historical data, but for your purposes you need to relate the historical data to the current situation. I'm not sure about the volcanic idea, from the graphs it doesn't appeared to have happened in recent geological time...
Well whatever the Marxist trolls think, I'm glad to see we're singing from the same hymn sheet on this one. Those guys need to go back to school and study the Scientific Method. Comparing apples and oranges is a very tricky business at the best of times. In fact, comparing different apples takes some doing.
A computer model proves jack shit. In fact it's even worse than that, a computer model proves what you want it to prove.
Why do you think engineers still build model bridges and test them in windtunnels at enormous expense!
As I've said passim, these whingeing Marxists should be dumped from a helicopter, naked, in the darkest heart of the Amazon Rain Forest and left to get on with it. At least then they wouldn't be interfering in MY life.
obviosuly steve knows something that thousands of climate scientists and the UN Intergovernmental Panel on Climate Change don't.
Further commentary on this load of hot air:
From the Canada Free Press
The graphs are good (for the most part). The part that is missed is that, on the historical chart of CO2 and temperature, the current CO2 level scores as around 5.5. That is, quite literally, off the chart. More importantly it represents a fluctuation in CO2 levels that is significantly larger than any natural fluctuation over the last 650,000 years.
Post a Comment